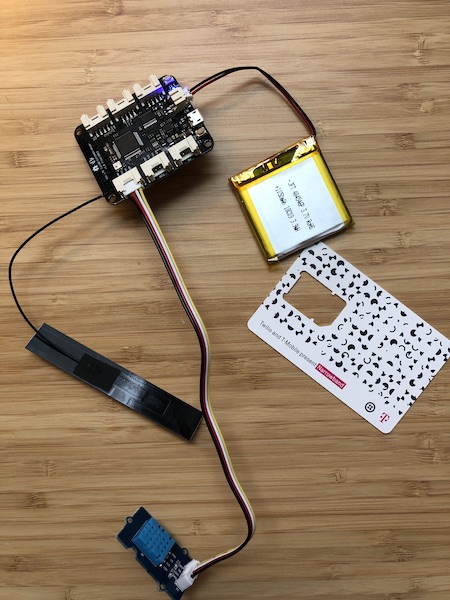
I just got my hands on the Twilio Narrowband dev kit… and it is a sweet piece of kit. It is centered around a small Arduino compatible board that has a lot of Seeed connectors. Most importantly it also has a cellular modem built in that is a designed to work with T-Mobile’s nationwide narrowband IoT network. This network use the guard bands on T-Mobiles channels. It is not high bandwidth; designed for moving text message sized bits of data. It does have good coverage though… and most importantly is cheap. Through Twilio, you can get a plan ~$10 per year for a device. At this price point you can start coming up with interesting ways to use this!
With the Twilio devkit you communicate with the board using “commands”, which are just short messages. There is an SDK, called Breakout, included with the devkit that makes it super simple to send and receive data over the network. While the examples are a quick way to start pulling data from the sensors, they just have the data going to the Twilio console. This is boring.
I wanted to drop the data into a nice graph, and it ended up being pretty easy to do. The Twilio console has a webhook that can do a HTTP Post everytime a new command comes in. I built a little function to take the data in and post it to a graphing app.
I wanted to graph Temperature and Humidity data and started from the Breakout example. I modified it a little so that output was a simple, comma separated value pair:
https://gist.github.com/robotastic/b3489cd9b4490ba80ce28aececc9e166
I then went over to Glitch and started working on a small function to take in the sensor data from HTTP Post and send it to Adafruit’s IO platform.
Here is my Project on Glitch:
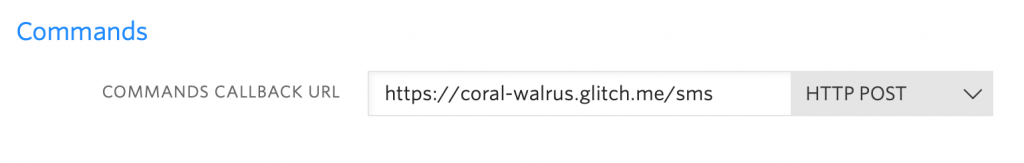
Take the URL for your Glitch project, with the path of ‘/sms’ and add it as the Command Callback on the Twilio Console for your SIM:
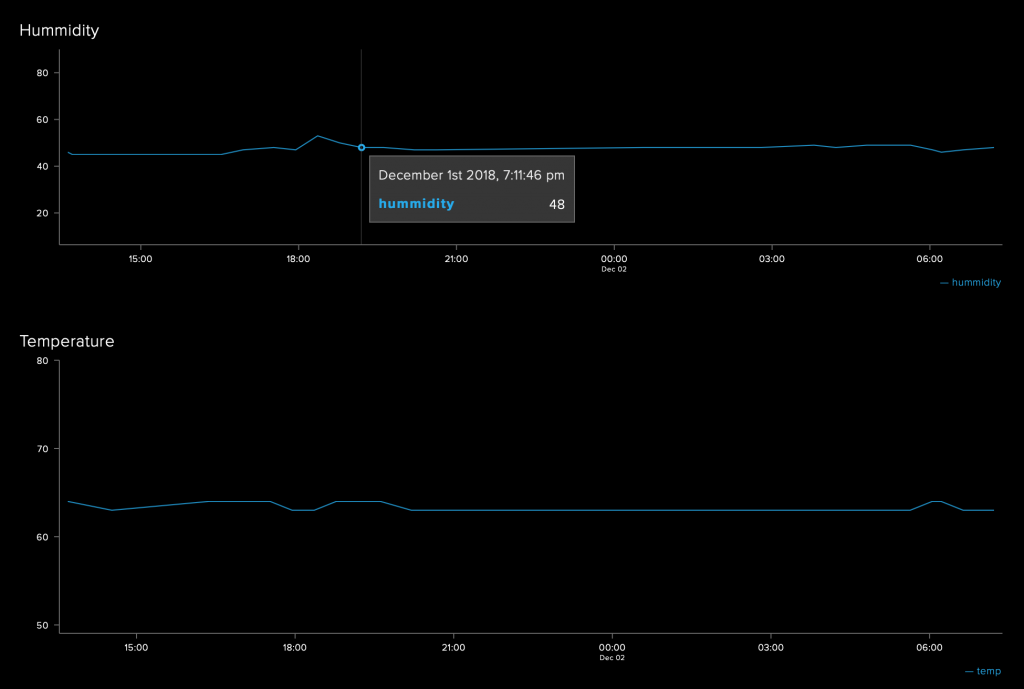
After that, it is time to create some Feeds and a Dashboard on the Adafruit IO Platform. After you create your account, copy your Username and Key to the .env file on Glitch. This is how the function logins into IO to post data. In the Glitch Project readme, there is a description of how this should be formatted in the .env file. Create two feeds called hummidity and temp. Also – I just realized I spelled humidity wrong. On the plus side I did it consistently on both Glitch and IO.
Finally, create a Dashboard in IO to show the data from each Feed.
There are still a few things to work on:
- It looks like there is an issue where the Dev Kit Board will only work if it is connected to the Serial Monitor in Arduino. If you just remove the Serial Prints you should be good to go though.
- I want to try and make the Dev Kit Board sleep in between transmissions, or atleast turn off the modem to try and save power.